- Joined
- Dec 16, 2024
- Messages
- 302
- Points
- 28
Support and Resistance MTF Indicator for MT4: A Multi-Timeframe Trading Tool
The Support and Resistance MTF Indicator for MT4 identifies and displays support and resistance levels from multiple timeframes on a single chart. This allows traders to spot stronger and more reliable levels when they align across multiple timeframes. For instance, an H1 support level is more significant if it aligns with the H4 chart.

This indicator is ideal for intraday, daily, weekly, and monthly charts, helping both beginner and advanced traders identify bullish or bearish trends and optimal entry and exit points quickly. Additionally, it integrates well with automated trading strategies.
The Support and Resistance MTF Indicator for MT4 identifies and displays support and resistance levels from multiple timeframes on a single chart. This allows traders to spot stronger and more reliable levels when they align across multiple timeframes. For instance, an H1 support level is more significant if it aligns with the H4 chart.

This indicator is ideal for intraday, daily, weekly, and monthly charts, helping both beginner and advanced traders identify bullish or bearish trends and optimal entry and exit points quickly. Additionally, it integrates well with automated trading strategies.
How It Works
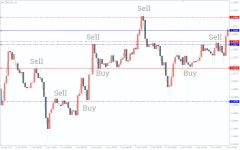
The indicator marks support levels with Blue lines and resistance levels with Red dotted lines. Two main trading approaches are commonly used:- Breakout Trading
- BUY Setup: Enter a BUY trade when the price breaks above a resistance level, signaling a bullish trend.
- Stop Loss: Below the nearest support level.
- Take Profit: At the next resistance level.
- SELL Setup: Enter a SELL trade when the price breaks below a support level, signaling a bearish trend.
- Stop Loss: Above the nearest resistance level.
- Take Profit: At the next support level.
- BUY Setup: Enter a BUY trade when the price breaks above a resistance level, signaling a bullish trend.
- Reversal Trading
- If the price fails to break resistance, it suggests buyers are losing strength, signaling a potential SELL opportunity.
- If the price fails to break support, it indicates sellers are weakening, signaling a potential BUY opportunity.

