- Joined
- Dec 16, 2024
- Messages
- 302
- Points
- 28
Support and Resistance Indicator for MetaTrader 4
The Support and Resistance Indicator for MetaTrader 4 (MT4) is a highly effective tool used by traders to identify potential support and resistance zones across multiple timeframes. This technical indicator automatically scans and displays support and resistance levels from various timeframes (such as H4, D1, W1, and MN) on your chart, helping traders identify key price levels with ease.This indicator is an essential asset for both novice and experienced traders, as it simplifies the process of determining areas where price action is likely to reverse or stall, thereby enhancing trading strategies.
Key Features of the Support and Resistance Indicator
- Multi-Timeframe Support:
- The indicator automatically scans different timeframes and shows the support and resistance zones from those timeframes on your current chart. For example, if you’re using an H4 timeframe, the indicator will display support and resistance zones from H4, D1, W1, and MN.
- Clear Visualization of Key Levels:
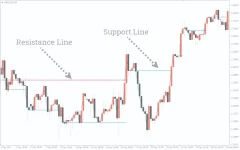
- The indicator draws horizontal lines to represent support (usually in dodger blue) and resistance (usually in red) levels. This makes it easier for traders to spot critical price levels.
- Automatic Detection:
- The indicator automatically detects and draws the support and resistance lines, saving traders the time and effort of manually identifying these levels.
- Versatility for Multiple Trading Strategies:
- This indicator is versatile and can be used for scalping, day trading, intraday trading, and swing trading. It works well with a variety of trading strategies and helps traders make informed decisions based on the support and resistance zones.
- Trend Reversal and Continuation Patterns:
- The indicator can be used for both trend reversal and trend continuation strategies. A broken support zone can act as a resistance zone, and vice versa.
How Do You Identify Forex Support and Resistance?
- Support is a level where the price tends to find buying interest, typically represented by a lower low in the price chart.
- Resistance is a level where the price tends to encounter selling pressure, usually represented by a higher high.
- Psychological Levels: These are rounded numbers like 1.4200, 1.5000, etc., and often act as strong support or resistance zones.
How Do You Draw Support and Resistance Lines?
- Trend Line Method: Draw a line connecting two or more peaks (resistance) or troughs (support). The more times the price touches the line, the stronger the support or resistance level.
- Horizontal Line Method: Draw a horizontal line across multiple highs or lows to identify clear support and resistance zones.
How to Trade with the Support and Resistance Indicator
- Visualizing the Zones:
- The red lines represent resistance zones, and the dodger blue lines represent support zones. These lines are automatically plotted on your chart.
- Trend Reversal Strategy:
- Look for a bounce off a support or resistance zone. If the price touches a support level and starts to rise, it may be a sign of a trend reversal (potential buy). Conversely, if the price hits a resistance level and starts to fall, it may indicate a trend reversal (potential sell).
- Trend Continuation Strategy:
- If the price breaks a support level, it becomes a new resistance zone, and you can look for a sell entry (short position). Conversely, if the price breaks a resistance level, it becomes a new support zone, and you can look for a buy entry (long position).
- Breakout Trading:
- When the price breaks through a support or resistance level, especially with increased volume, this can signal a continuation of the trend. Traders can open buy or sell positions depending on the direction of the breakout.

Trading Example
- Trend Reversal:
- The price approaches a support level (dodger blue line), and starts to show signs of bouncing back upward. This can be an opportunity for a buy position.
- Conversely, if the price touches a resistance level (red line) and starts to reverse downward, this is a potential sell signal.
- Trend Continuation:
- If the price breaks through a support level (dodger blue line), it could now act as a resistance, signaling a potential sell entry.
- If the price breaks through a resistance level (red line), it could now act as a support, signaling a potential buy entry.

