- Joined
- Dec 16, 2024
- Messages
- 302
- Points
- 28
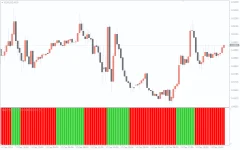
The Super Trend Histogram Indicator for MetaTrader 4 (MT4) is a highly effective and user-friendly tool designed to simplify trend analysis by providing clear visual cues through color-coded histograms. This makes it easy for traders to identify prevailing market trends and make informed decisions quickly.

By using the Super Trend Histogram Indicator in conjunction with other tools, such as price action or volume indicators, traders can enhance their decision-making process and optimize their trading results.

Key Features of the Super Trend Histogram Indicator
- Color-Coded Histogram: The indicator uses a green and red histogram to represent bullish and bearish trends, respectively. This color coding simplifies trend analysis by clearly marking the direction of the market.
- Easy-to-Interpret Signals: The transition between green and red bars makes it easy for traders to spot changes in market direction, providing a clear visual cue for entry or exit points.
- Customizable Settings: Traders can adjust the Super Trend Period and Multiplier settings to align the indicator with their trading strategy and timeframe preferences.
How to Use the Super Trend Histogram Indicator
The Super Trend Histogram Indicator is ideal for traders seeking a simple method to track market trends. By using this indicator, traders can easily determine when to enter or exit trades based on the direction of the market trend.Key Trading Signals and Strategies
- Bullish Signal (Green Bars):
- When the histogram bars are green, this indicates that the market is in a bullish trend. Traders can use this signal to enter a buy position, especially when the market shows strong upward momentum.
- Entry Strategy: Enter a buy trade when the histogram bars turn green and confirm the trend with other indicators or price action.
- Bearish Signal (Red Bars):
- When the histogram bars are red, this indicates that the market is in a bearish trend. Traders can use this signal to enter a sell position, especially when the market shows strong downward momentum.
- Entry Strategy: Enter a sell trade when the histogram bars turn red and confirm the trend with other indicators or price action.
- Trend Reversal:
- A transition between green and red bars signals a trend shift, either from bullish to bearish or vice versa. These transitions provide key opportunities to enter trades at the beginning of a trend change.
- Example Strategy: After a trend reversal (green to red or red to green), traders can place trades based on the new trend direction. Always consider waiting for confirmation from other indicators or price action before entering a position.
- Trend Confirmation:
- The Super Trend Histogram Indicator is highly effective in confirming existing strategies. For example, traders using breakout strategies can look for green bars to confirm an upward breakout or red bars for a downward breakout.
- Pullback Entries: Traders can use the indicator to time pullback entries in the direction of the dominant trend, ensuring alignment with the prevailing market momentum.
Conclusion
The Super Trend Histogram Indicator for MT4 is an excellent tool for traders who want to identify market trends quickly and visually. Its color-coded histogram provides an intuitive way to track trends and spot potential entry or exit points with ease. Whether you're a beginner or an experienced trader, this indicator simplifies trend analysis and helps reduce the risk of false signals, making it a valuable addition to any trading strategy.By using the Super Trend Histogram Indicator in conjunction with other tools, such as price action or volume indicators, traders can enhance their decision-making process and optimize their trading results.

