- Joined
- Dec 16, 2024
- Messages
- 302
- Points
- 28
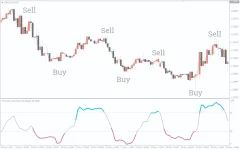
The Smoothed RSI Indicator for MT4 is a modified version of the standard Relative Strength Index (RSI) that smoothens out price movements to provide clearer overbought and oversold signals. This indicator helps traders identify bullish and bearish trends by visualizing these levels and allowing for multi-timeframe analysis. It suits both beginner and advanced traders by providing clear signals and facilitating the development of various trading strategies.
Key Features of the Smoothed RSI Indicator
- Overbought and Oversold Zones:
- Overbought Zone: Represented in DeepSkyBlue color.
- Oversold Zone: Represented in PaleVioletRed color.
- RSI Levels: When RSI values are within these zones, the indicator is in DimGray, signifying neutral or no action zones.
- Multi-Timeframe (MTF) Capabilities:
- Traders can select the timeframe for RSI calculations, allowing them to view multiple timeframe RSI values on the same chart. This provides a top-down technical analysis and helps in identifying the broader market trend.

Smoothed RSI Trading Signals
Bullish Signal (BUY)
- Condition: The RSI reaches the oversold level and then rises above it.
- Signal: The color of the RSI changes from Blue (oversold) to Gray, indicating the start of a bullish price trend.
- Entry: Enter a BUY position when the color change occurs.
- Stop Loss: Place the stop loss below the previous swing low to minimize risk.
- Take Profit: Set a target to take profits when the price reaches above the overbought levels or if the RSI changes color back to Blue.
Bearish Signal (SELL)
- Condition: The RSI reverses from the overbought level and falls below it.
- Signal: The color of the RSI changes from Blue to DimGray, indicating the start of a bearish price trend.
- Entry: Enter a SELL position when the color change occurs.
- Stop Loss: Place the stop loss above the previous swing high to protect the position.
- Take Profit: Book profits when the price reaches the oversold level or if the indicator changes color from DimGray to Red.
Divergence Trading Strategy
A powerful additional strategy is divergence trading, which traders often apply to RSI or Stochastic indicators. Divergence occurs when the price makes a new high/low, but the indicator fails to confirm that movement, signaling potential trend reversals.- Bullish Divergence: Occurs when the price makes a new low, but the RSI fails to reach new lows, indicating a potential upward reversal.
- Bearish Divergence: Occurs when the price makes a new high, but the RSI fails to make a new high, signaling a potential downward reversal.
Conclusion
The Smoothed RSI Indicator for MT4 is a useful tool for identifying overbought and oversold conditions and formulating trading strategies. It smoothens the traditional RSI values, making them easier to interpret. Some of its key features include:- Multi-timeframe analysis, allowing traders to visualize RSI values from different timeframes.
- Color changes that indicate potential trend shifts, providing clear BUY and SELL signals.
- The ability to incorporate divergence strategies to improve accuracy.

