- Joined
- Dec 16, 2024
- Messages
- 302
- Points
- 28
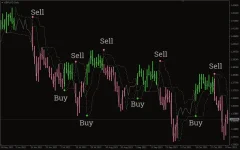
The Perfect Trendline Indicator is a simple yet effective MT4 (MetaTrader 4) tool designed to help traders identify market trends and generate precise BUY and SELL signals. This indicator uses a combination of fast and slow trendlines along with color-coded dots to provide clear trading signals.

How the Perfect Trendline Indicator Works
Trendlines
The indicator features two trendlines:- Fast Trendline: Reacts quickly to price changes.
- Slow Trendline: Moves more gradually, reflecting longer-term trends.
Color-Coded Dots
- Green Dots: Indicate a BUY signal, suggesting a bullish trend or upward movement in price.
- Red Dots: Indicate a SELL signal, suggesting a bearish trend or downward movement in price.
Candlestick Colors
The Perfect Trendline Indicator also colors the candlesticks:- Green Candlesticks: Indicate bullish momentum.
- Red Candlesticks: Indicate bearish momentum.
- No color change: Indicates neutrality in the market, suggesting no clear trend.
Perfect Trendline Indicator BUY/SELL Signals
BUY Signal (Long Position)
- A green dot appears, signaling a potential buying opportunity.
- The green trendline crosses above the red trendline, confirming the bullish trend.
- Traders should consider entering a long position when these conditions are met.
SELL Signal (Short Position)
- A red dot appears, signaling a potential selling opportunity.
- The red trendline crosses above the green trendline, confirming the bearish trend.
- Traders should consider entering a short position when these conditions are met.
Exit Signals
- Exit Long Positions: When a red dot appears, it suggests the end of the bullish trend, signaling that it's time to exit long positions.
- Exit Short Positions: When a green dot appears, it suggests the end of the bearish trend, signaling that it's time to exit short positions.
Important Considerations
- The Perfect Trendline Indicator is best used on longer timeframes (e.g., daily charts) for more reliable signals, as it may produce false signals on lower timeframes.
- Neutral Market Conditions: The indicator may not color the candlesticks if the market is neutral, implying indecision and no clear trend.
- Short-Term Reversals: Occasionally, green and red dots may appear, signaling short-term trend reversals. However, the overall trend will typically remain bullish or bearish.
Conclusion
The Perfect Trendline Indicator is a valuable tool for traders looking to follow the trend and make informed trading decisions. By using trendlines and color-coded dots, it provides clear BUY and SELL signals, along with exit points to optimize profits. The indicator works best on longer timeframes and is free to download, making it easily accessible for all traders.For those who prefer a straightforward approach to trading, the Perfect Trendline Indicator is an excellent choice to help you identify market trends, confirm entry and exit points, and maximize trading opportunities.

