- Joined
- Dec 16, 2024
- Messages
- 302
- Points
- 28
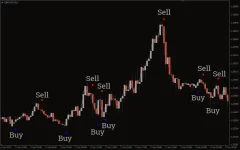
The Magic Dots 2 MTF Alerts Indicator for MT4 is a moving average-based indicator that provides Buy and Sell dot signals on the price chart. It also offers multi-timeframe (MTF) functionality, allowing traders to view signals from different timeframes within the current price chart. This feature helps forex traders identify both bullish and bearish market trends, providing them with precise trading opportunities based on dot signals.
The indicator works well on intraday charts (like M15, M30) as well as longer timeframes (such as daily, weekly, and monthly). It is suitable for both beginner and advanced traders looking for clear trend-following signals.
The indicator works well on intraday charts (like M15, M30) as well as longer timeframes (such as daily, weekly, and monthly). It is suitable for both beginner and advanced traders looking for clear trend-following signals.
Key Features of the Magic Dots 2 MTF Alerts Indicator
- Bullish and Bearish Signals:
- Blue Dots: Indicate a bullish market trend, signaling a Buy trade opportunity.
- Red Dots: Indicate a bearish market trend, signaling a Sell trade opportunity.
- Multi-Timeframe (MTF) Capability:
- Traders can enable signals from higher timeframes (e.g., H1, H4) on a lower timeframe (e.g., M15, M30). This allows them to refine their entry points and make more informed decisions.
- Alerts:
- The indicator provides various types of alerts when a Buy or Sell signal appears. Traders can choose to enable or disable these alerts in the indicator settings.

Magic Dots 2 MTF Alerts Indicator Trading Signals
Bullish Signal (Blue Dot)
- Condition: The appearance of a Blue dot on the chart indicates a bullish trend.
- Action: Traders should place a Buy order when the blue dot appears.
- Stop Loss: Place the stop loss below the previous swing low to protect the position.
- Take Profit: Exit the trade when the opposite signal (Red dot) appears or once a good risk-reward ratio is achieved. As this is a trend-following indicator, riding the trend for a longer duration can be beneficial.
Bearish Signal (Red Dot)
- Condition: The appearance of a Red dot indicates a bearish trend.
- Action: Traders should place a Sell order when the red dot appears.
- Stop Loss: Place the stop loss above the previous swing high to minimize risk.
- Take Profit: Exit the trade when the opposite signal (Blue dot) appears or if a good risk-reward ratio is achieved.
Using Multi-Timeframe (MTF) Signals
The MTF feature of the Magic Dots 2 MTF Alerts Indicator allows traders to apply trading signals from a higher timeframe to a lower timeframe chart. For example:- A trader could apply H1 (1-hour) signals on an M15 (15-minute) chart. This can help refine the entry points, ensuring that the trader is aligning their trades with the larger market trend.
- By combining different timeframes, traders can gain a clearer picture of the market direction and enhance the probability of successful trades.
Example of Using Magic Dots 2 MTF Alerts Indicator
- On a GBPUSD M15 chart:
- Bullish Signal: A Blue dot appears, indicating an uptrend. The trader enters a Buy position with the stop loss below the swing low. They can exit when the Red dot appears or when a sufficient risk-reward ratio is reached.
- Bearish Signal: A Red dot appears, signaling a downtrend. The trader enters a Sell position with the stop loss above the swing high.
- MTF Strategy Example:
- In the same GBPUSD M15 chart, the trader can enable H1 (hourly) signals to get a broader view of the market trend. If the H1 Blue dot is aligned with the M15 Blue dot, this reinforces the Buy signal, and the trader can place a higher-conviction trade.
Conclusion
The Magic Dots 2 MTF Alerts Indicator for MT4 is a trend-following tool that provides Buy and Sell signals using colored dots on the price chart. It works well in intraday and longer timeframes, offering multi-timeframe support to refine trading signals. The main advantages include:- Easy-to-interpret Buy/Sell signals with Blue and Red dots.
- Multi-timeframe functionality to enhance decision-making by showing higher timeframe trends on lower timeframe charts.
- Customizable alerts for real-time trading notifications.

