- Joined
- Dec 16, 2024
- Messages
- 302
- Points
- 28
The MACD with EMA Indicator combines two of the most powerful technical tools — the MACD (Moving Average Convergence Divergence) and EMA (Exponential Moving Average) — to give traders a clear view of the market trend and generate accurate BUY and SELL signals.
This indicator includes:
- Two EMAs: A fast and a slow EMA.
- MACD Signal Line: The difference between the two EMAs is plotted as a signal line.
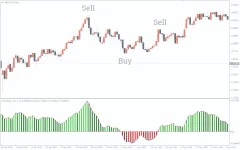
- MACD Histogram: It shows the strength and direction of the market trend, with colored bars to indicate bullish or bearish momentum.

How the MACD with EMA Indicator Works
Signal Line
- BUY Signal: When the bars go above the signal line, it indicates an uptrend.
- SELL Signal: When the bars go below the signal line, it indicates a downtrend.
Histogram
- Green Bars: Indicates bullish momentum (uptrend). Traders should look for buying opportunities.
- Red Bars: Indicates bearish momentum (downtrend). Traders should consider selling opportunities.
Trend Continuation and Reversal
- Trend Continuation: When the histogram remains in one color (green or red) for an extended period, the market is likely continuing in that direction.
- Trend Reversal: A change in color (from green to red or vice versa) signals a possible reversal in trend.
MACD with EMA Indicator BUY/SELL Signals
BUY Signal
- The histogram paints green bars, indicating bullish momentum.
- The bars go above the signal line, suggesting a buying opportunity.
SELL Signal
- The histogram paints red bars, indicating bearish momentum.
- The bars go below the signal line, suggesting a selling opportunity.
MACD vs EMA
- MACD: A combination of two EMAs (fast and slow) plotted along with a histogram. It reflects the convergence and divergence between the moving averages.
- EMA: A single moving average that gives more weight to recent prices. The MACD uses EMA to generate its signals.
Conclusion
The MACD with EMA Indicator is an essential tool for forex traders looking for reliable trend-following signals. It combines the power of the EMA for trend direction and MACD for momentum, making it a strong tool for identifying BUY and SELL opportunities. Its ability to highlight market divergences and provide reliable trend continuation and reversal signals makes it a valuable addition to any trading strategy.This indicator is free to download and easily accessible for traders, making it a must-have for both beginner and experienced traders.

