- Joined
- Dec 16, 2024
- Messages
- 302
- Points
- 28
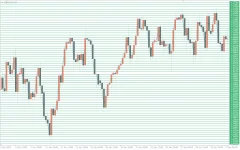
The Grid Builder Indicator for MetaTrader is a customizable tool that allows traders to adjust the grid lines on the chart to suit their trading needs. Unlike the fixed grid lines provided by MetaTrader, this indicator lets users specify the distance between grid lines, providing greater flexibility in analyzing price movements. It's a helpful tool for both novice and professional traders, especially for those engaged in scalping, day trading, or swing trading.


Key Features of the Grid Builder Indicator:
- Customizable Grid Lines: Traders can define the distance between the grid lines (e.g., 10 pips) to better gauge price movements and measure the distance a trend has covered.
- Measurement of Pips: It makes it easy to measure the number of pips a currency pair has moved, which is particularly useful for scalpers who need to quickly assess the value of a trade.
- No Buy/Sell Signals: The indicator is not a signal-generating tool, but rather a tool for visualizing price action and gauging market dynamics.
- Psychological Levels: By adjusting the grid lines, traders can easily spot psychological levels that often serve as key support and resistance areas. These levels can become significant areas for trading opportunities.
How to Use the Grid Builder Indicator:
- Setting the Grid Lines: Adjust the grid lines to a distance that fits your trading style. For example, you could set the grid to 10 pips for scalping, allowing you to easily monitor small price movements.
- Identifying Support/Resistance Zones: Use the grid lines to identify key psychological levels. These are price levels where significant buying and selling tend to occur, often acting as support or resistance.
- Fundamental Trading: The Grid Builder indicator is also useful for fundamental traders. It allows you to quickly see how far a currency pair has moved in terms of pips, helping you make more informed decisions during news releases or economic events.
Example of Use:
- Scalping: Set the grid lines to 10 or 20 pips. As the price moves, you'll see how many pips the market has covered. This is particularly useful for scalpers who need to track quick market movements.
- Identifying Key Levels: The grid lines can help you identify areas of interest, such as psychological levels where price tends to reverse or consolidate. For example, a 100-pip distance on the grid could align with major support or resistance levels, signaling potential entry or exit points.
Advantages of the Grid Builder Indicator:
- Customizable Grid Distance: Traders can set the grid lines according to their trading preferences, making it suitable for different trading styles.
- Clear Visualization: The grid lines give a clear visual representation of price movements, making it easier to assess market trends.
- Helps Identify Key Levels: By displaying grid lines, traders can spot psychological levels, which can be used to identify potential areas of support and resistance.

