- Joined
- Dec 16, 2024
- Messages
- 302
- Points
- 28
FXDD Indicator for MT4: Trend-Following Made Simple
The FXDD Indicator is a powerful and straightforward trend-following tool designed for MetaTrader 4 (MT4) platforms. It utilizes multiple layers of trend filters to provide accurate price movement direction signals, helping traders with trend analysis and market momentum monitoring.

The FXDD Indicator is a powerful and straightforward trend-following tool designed for MetaTrader 4 (MT4) platforms. It utilizes multiple layers of trend filters to provide accurate price movement direction signals, helping traders with trend analysis and market momentum monitoring.

Key Features
- Trend Detection:
- The FXDD Indicator helps determine the overall market trend, highlighting when the market is bullish, bearish, or neutral.
- It doesn't indicate specific buy/sell levels but focuses on identifying the strength or weakness of the current market trend.
- Multi-Timeframe Compatibility:
- The indicator works seamlessly across all MT4 timeframes, making it suitable for various trading strategies and styles, whether short-term or long-term.
- Asset Versatility:
- FXDD works across multiple financial instruments, including forex, stocks, ETFs, and cryptocurrencies, making it adaptable to different asset classes.
How to Use the FXDD Indicator for Trend Analysis
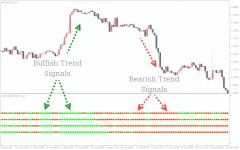
The FXDD Indicator consists of four rows, each representing a 5-period moving average calculated using different parameters. These rows display the trend conditions, allowing traders to assess market momentum effectively.Trend Signals:
- Bullish Market: When most of the bars in the same vertical position turn green, it indicates a strong bullish trend.
- Bearish Market: When the highest number of bars turn red, it signals a bearish trend.
- Neutral Market: If half of the bars are green and the other half are red, the market is considered to be in a neutral or sideway trend.
Trading Strategy Example
- Bullish Signal: When all blocks in a row turn green, it indicates that the market is in a strong bullish trend, suggesting potential buy opportunities.
- Bearish Signal: When all blocks turn red, it signals a strong bearish trend, suggesting possible sell positions.
- Neutral/Sideways Signal: If the colors are mixed, the market is in a consolidation phase, and traders may choose to stay out of the market or trade cautiously.

