- Joined
- Dec 16, 2024
- Messages
- 302
- Points
- 28
FXCX Divergence Indicator for MT4: A Guide to Trend Reversal Signals
The FXCX Divergence is a powerful technical indicator designed to help traders identify trend reversals in MetaTrader 4 (MT4) charts. It combines price action analysis, divergence, and key technical indicators to signal potential market highs and lows, providing traders with accurate buy and sell opportunities.

The FXCX Divergence is a powerful technical indicator designed to help traders identify trend reversals in MetaTrader 4 (MT4) charts. It combines price action analysis, divergence, and key technical indicators to signal potential market highs and lows, providing traders with accurate buy and sell opportunities.

Key Features
- Divergence Detection:
- The FXCX Divergence Indicator uses the 21-period Relative Strength Index (RSI) to spot divergence patterns between price movements and momentum, signaling potential reversals.
- Divergence occurs when the price reaches a new high or low while the RSI fails to do so, suggesting a weakening trend and potential reversal.
- EMA Crossovers for Signal Filtering:
- The indicator filters its divergence signals using the crossovers of 5-period and 13-period Exponential Moving Averages (EMA), enhancing signal accuracy.
- The combination of the RSI and EMA provides a reliable method for determining trend reversal points.
- Visual Simplicity:
- FXCX Divergence displays clear arrow signals on the chart, making it easy for traders to spot potential entry points. Yellow arrows represent bullish divergences, while aqua-colored arrows signify bearish divergences.
How to Use FXCX Divergence in MT4 for Forex and Stock Trading
The FXCX Divergence Indicator combines two core technical tools: RSI and EMA. Here's how to apply it for effective trend reversal signals:Step 1: Divergence Signal Identification
- Bullish Divergence: When the RSI shows a bullish divergence (yellow arrow), it signals that the price is likely to reverse from a downtrend to an uptrend. This occurs when the price forms lower lows, but the RSI forms higher lows, indicating increasing bullish momentum.
- Bearish Divergence: Conversely, when the RSI shows a bearish divergence (aqua arrow), it suggests that the price is likely to reverse from an uptrend to a downtrend. This happens when the price makes higher highs, but the RSI makes lower highs, indicating weakening bullish momentum.
Step 2: Confirm Divergence with EMA
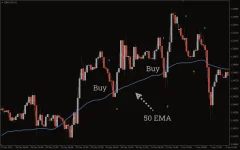
- The FXCX Divergence indicator can be enhanced by adding a 50-period EMA or other relevant moving averages.
- When the price is in close proximity to the EMA, it can act as a support or resistance level. A bullish divergence near the EMA, where the price bounces upward, could provide a solid buy opportunity.
- Similarly, a bearish divergence near the EMA, where the price fails to maintain its upward momentum, could signal a sell opportunity.
Step 3: Consider Additional Technical Factors
- While the indicator offers divergence signals, it's important to filter these signals by considering other technical factors such as candlestick patterns, support and resistance levels, or momentum indicators.
Step 4: Profit Taking and Risk Management
- FXCX Divergence doesn’t provide exit signals, so it’s recommended to use a risk-to-reward ratio (e.g., 1:2) to determine exit points.
- You can also use a faster-moving average to monitor short-term trend changes and adjust your exit strategy accordingly.

