- Joined
- Dec 16, 2024
- Messages
- 302
- Points
- 28
Fractals are local extremums or turning points on the price chart, indicating either a potential trend reversal or support/resistance levels. The Fractal Levels Indicator enhances the standard fractal tool by connecting these extremums with lines to form key support and resistance levels.
Types of Fractals
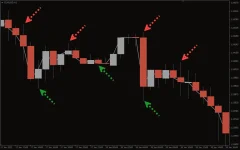
- Bullish Fractal:
- Formed when the highest high occurs compared to the two bars to the left and two bars to the right.
- Signaled by green arrows on the chart.
- Bearish Fractal:
- Formed when the lowest low occurs compared to the two bars to the left and two bars to the right.
- Signaled by red arrows on the chart.
How to Use Fractals in MT4
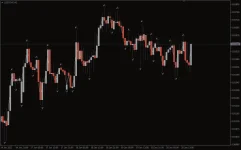
- Default Indicator:
- Fractals are integrated into all MetaTrader 4 (MT4) terminals.
- To add the indicator, go to Main Menu > Insert > Indicators > Bill Williams > Fractals.
- The indicator shows gray icons representing bullish (green) and bearish (red) fractals.
- Support and Resistance:
- Fractals act as key support and resistance levels.
- The downside: Fractals appear with a delay of 2 bars. For instance, a fractal on Tuesday's bar will not appear until the Thursday bar closes.
Fractal Levels Indicator
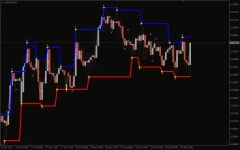
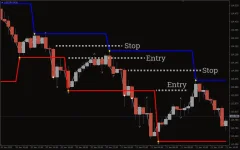
The Fractal Levels Indicator takes the concept of fractals a step further by connecting bullish and bearish fractals with lines that represent support and resistance levels.- Blue Line: Connects bearish fractals (resistance).
- Red Line: Connects bullish fractals (support).
Trading with Fractal Levels Indicator
Fractals do not provide simple buy or sell signals on their own. However, traders can combine them with other indicators or use techniques such as fractals breakouts to generate actionable signals.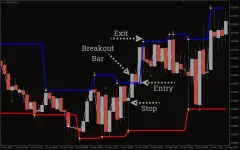
Fractal Levels Buy Signal (Long Position)
To enter a long position:- Identify a resistance line formed by multiple bearish fractals.
- Wait for a breakout — when the price closes above the resistance level.
- Place a Buy-Limit order at the level where the breakout occurred.
- Set a Stop-Loss just below the low of the breakout bar.
- Close the position at the next resistance level.
- Use a reward-to-risk ratio greater than 1.5:1.
- Alternatively, use trailing stops to lock in profits.
Fractal Levels Sell Signal (Short Position)
To enter a short position:- Identify a support line formed by multiple bullish fractals.
- Wait for a breakdown — when the price closes below the support level.
- Place a Sell-Limit order at the level where the breakdown occurred.
- Set a Stop-Loss just above the high of the breakdown bar.
- Close the position at the next support level.
- Use a reward-to-risk ratio greater than 1.5:1.
- Alternatively, use trailing stops.
Conclusion
The Fractal Levels Indicator for MT4 is an essential tool for trading around support and resistance levels. By visualizing these levels, traders can make informed decisions and capitalize on potential market breakouts or reversals.Key Features:
- Visualizes support and resistance levels with blue and red lines.
- Combines fractals with other indicators to confirm buy and sell signals.
- Can be used for long-term or intraday trading.
- Does not repaint but note that fractals appear with a slight delay.
Risk Management:
- Always use proper risk management techniques like setting stop-loss levels and practicing on demo accounts before going live.

