- Joined
- Dec 16, 2024
- Messages
- 302
- Points
- 28
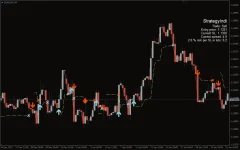
The Forex Strategy Indicator is designed to simplify forex trading for novice traders by providing clear buy and sell signals, along with easy-to-follow rules. The indicator combines trend-following techniques with effective position management to help traders stay in the market as long as possible.


Key Features of the Forex Strategy Indicator:
- Blue Arrows: Indicate entry points for long positions (buy signals).
- Blue Crosses: Indicate the exit points for long positions (close buy signals).
- Red Arrows: Indicate entry points for short positions (sell signals).
- Red Crosses: Indicate the exit points for short positions (close sell signals).
- Alerts: Traders are notified when a trade signal arises, ensuring they never miss a potential entry or exit point.
How the Forex Strategy Indicator Works:
- Exponential Moving Averages (EMAs): The indicator uses two exponential moving averages (EMAs) to identify entry signals, helping traders follow the prevailing trend.
- Chandelier Indicator: The classic Chandelier indicator (shown as a yellow dotted line) is used for position management. It calculates a stop-loss level that adapts to market conditions and is used to trail the stop-loss as the trend progresses.
Example of Trading Signals:

Buy Signal (Long Position)
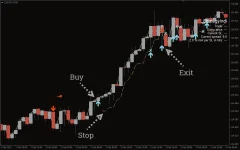
- Entry: A blue arrow appears, indicating the market is in a bullish trend. Traders can enter a long position immediately after the signal.
- Stop-Loss: The yellow dotted line (Chandelier indicator) shows where to place the stop-loss.
- Trailing Stop: As the price moves in the direction of the trend, traders can adjust the stop-loss higher, locking in profits.
- Exit: The blue cross appears to show when to close the long position, signaling the end of the uptrend.

Sell Signal (Short Position)
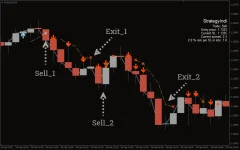
- Entry: A red arrow appears when the market starts to turn bearish. Traders can enter a short position at this point.
- Stop-Loss: The yellow dotted line is used to place a stop-loss for the short position.
- Exit: The red cross shows when to close the short position.
Example Trades:
Example 1: Buy Trade
- Signal: A blue arrow appears on the USDJPY M30 chart, indicating a bullish trend.
- Action: Enter a long position, placing a stop-loss based on the Chandelier indicator.
- Trailing Stop: As the trend continues, the stop-loss is moved higher to protect profits.
- Exit: The blue cross signals to exit the position once the trend begins to reverse.
Example 2: Sell Trade
- Signal: A red arrow appears on the EURUSD M5 chart, indicating a bearish trend.
- Action: Enter a short position, using the Chandelier indicator for stop-loss placement.
- Exit: The red cross signals the exit, and a loss is incurred after the stop-loss is triggered. A second sell signal appears, which leads to a profitable trade.
Advantages of the Forex Strategy Indicator:
- Simplifies Trading: This indicator provides a complete strategy with clear buy and sell signals, making it easier for novice traders to follow.
- Trend-Following Approach: By using moving averages and the Chandelier indicator, traders can capitalize on trends and manage their trades effectively.
- Flexibility: The trader can choose whether to enter a trade based on the signal, giving them control over their trading decisions.

