- Joined
- Dec 16, 2024
- Messages
- 302
- Points
- 28
The Derivative Oscillator is a powerful technical indicator that combines enhanced versions of the Relative Strength Index (RSI) and Moving Average Convergence Divergence (MACD) to provide more accurate and reliable trading signals. Its versatility allows traders to analyze any instrument across any timeframe while complementing other tools like price action and chart patterns.

In a bearish scenario:

How the Derivative Oscillator is Calculated
The Derivative Oscillator is derived by:- Double-Smoothing RSI: The RSI is smoothed twice to eliminate noise.
- Simple Moving Average (SMA): A simple moving average of the double-smoothed RSI is calculated.
- MACD Calculation: The MACD is computed as the difference between a 26-period EMA (Exponential Moving Average) and a 12-period EMA.
How to Use the Derivative Oscillator
The Derivative Oscillator operates similarly to the conventional MACD but incorporates RSI for added precision. Below are the key ways to use the indicator:1. Zero-Line Crossover
- Buy Signal: A crossover above the zero line signals a bullish opportunity.
- Sell Signal: A crossover below the zero line signals a bearish opportunity.
2. Slope Analysis
- Bullish Trend: The bars slope upward from negative to positive, indicating upward momentum.
- Bearish Trend: The bars slope downward from positive to negative, showing downward momentum.
3. Bar Length
- Strength of Trend: The length of the bars reflects the trend's magnitude:
- Long bullish bars = Strong bullish trend.
- Long bearish bars = Strong bearish trend.
4. Divergence
- Bullish Divergence: The price makes lower lows while the oscillator makes higher lows, signaling a potential upward reversal.
- Bearish Divergence: The price makes higher highs while the oscillator makes lower highs, indicating a possible downward reversal.
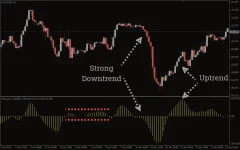
Real Market Example: EUR/JPY
In a ranging market, the oscillator generates short bars near the zero line, signaling weak trends. Traders should avoid entering trades in such conditions.In a bearish scenario:
- Bars slope downward into the negative zone.
- Longer bearish bars indicate strong downward momentum.
- Bars climb above the zero line.
- Longer bullish bars signify strong upward momentum.
Advantages of the Derivative Oscillator
- Enhanced Accuracy: Combines RSI and MACD for more reliable signals.
- Trend Strength Analysis: Bar length reveals trend magnitude.
- Divergence Detection: Helps anticipate potential reversals.
- Multi-Asset & Multi-Timeframe: Works on any trading instrument and timeframe.
Limitations
- Lagging Indicator: Like most oscillators, the Derivative Oscillator may lag due to smoothing, making it unsuitable for highly volatile markets.
- False Signals: It may generate misleading signals during ranging or consolidating markets.

