- Joined
- Dec 16, 2024
- Messages
- 302
- Points
- 28
The DAT MACD Indicator for MetaTrader 4 is an advanced version of the traditional MACD indicator that uses Triple Exponential Moving Averages (TRIX) to reduce market noise and provide more accurate trading signals. It incorporates both fast and slow-moving averages to offer a clear view of market behavior, oscillating around a zero line to signal buy and sell opportunities. The indicator is also useful as a momentum tool, with positive values suggesting increasing momentum and negative values signaling reducing momentum.


Key Features of the DAT MACD Indicator:
- Smoothed Moving Averages: The indicator uses Triple Exponential Averages (TRIX) to minimize market noise and smooth out price movements.
- Buy/Sell Signals: The fast and slow-moving averages cross above or below the zero line to trigger buy or sell signals.
- Momentum Indicator: Positive values suggest growing momentum, while negative values indicate weakening momentum.
- Crossovers: When the fast-moving average crosses above the slow-moving average, it signals a buy. When the fast-moving average crosses below the slow-moving average, it signals a sell.
How to Use the DAT MACD Indicator for MT4:
1. Buy Signal:
- When to Buy: A buy signal is triggered when the fast-moving average crosses above the slow-moving average and both lines move above the zero line.
- Indicator Behavior: The lines will turn green to indicate an uptrend.
2. Sell Signal:
- When to Sell: A sell signal occurs when the fast-moving average crosses below the slow-moving average, and both lines move below the zero line.
- Indicator Behavior: The lines turn red to indicate a downtrend.
3. Exit Strategy:
- Exit Long Positions: Close long (buy) positions when the fast-moving average crosses below the slow-moving average and both lines fall below the zero line.
- Exit Short Positions: Close short (sell) positions when the fast-moving average crosses above the slow-moving average and both lines move above the zero line.
Trading Example:

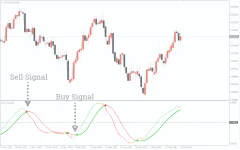
- Sell Signal Example (AUD/CAD):
- The fast-moving average crosses below the slow-moving average, and the lines turn red.
- The moving averages drop and cross below the zero line, signaling a bearish trend.
- After the sell signal, the price declines significantly.

- Buy Signal Example (AUD/CAD):
- The fast-moving average crosses above the slow-moving average, and the lines turn green.
- The moving averages rise above the zero line, signaling a bullish trend.
- After the buy signal, the price increases, confirming the trade.
Best Practices:
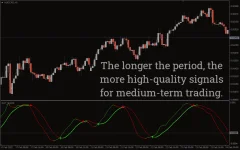
- Short-Term and Long-Term Use: The DAT MACD indicator works well for both short-term and long-term trading across all timeframes. It can be applied in scalping, day trading, and swing trading strategies.
- Combine with Other Indicators: To increase reliability, the DAT MACD indicator can be combined with other technical indicators, such as support and resistance levels, RSI, or Moving Averages, for enhanced confirmation of signals.

