- Joined
- Dec 16, 2024
- Messages
- 302
- Points
- 28
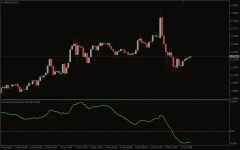
The Cumulative Momentum Indicator for MetaTrader 4 (MT4) is a powerful tool designed to help traders assess the strength and direction of market momentum.
By tracking price acceleration and deceleration, this indicator provides traders with valuable insights into market trends and potential reversals. Its clear visual representation and customizable settings make it an excellent choice for traders of all experience levels.

Overall, the Cumulative Momentum Indicator is a versatile and valuable tool for anyone looking to improve their market analysis and make well-informed trading decisions.
By tracking price acceleration and deceleration, this indicator provides traders with valuable insights into market trends and potential reversals. Its clear visual representation and customizable settings make it an excellent choice for traders of all experience levels.

Key Features of the Cumulative Momentum Indicator
- Momentum Line: The indicator plots a line that represents the cumulative momentum of an asset over a specified period. This line helps visualize the overall strength of market movements.
- Zero Level: The momentum line crosses above or below the zero level, providing crucial signals:
- Above Zero: Increasing bullish momentum and potential upward trends.
- Below Zero: Bearish momentum and potential downward movement.
- Trend Strength: The steepness of the momentum line indicates the strength of the trend. Steeper lines signify stronger momentum, while flatter lines suggest weaker momentum or consolidation.
- Consolidation: Flat or horizontal sections of the momentum line indicate periods of low activity or market consolidation, which could signal indecisiveness or waiting for a breakout.
- Divergence: Divergence between the momentum line and price action can act as a precursor to market reversals, providing advanced traders with additional insight into potential trend changes.
Cumulative Momentum Indicator Trading Signals
- Bullish Momentum (Above Zero):
- When the momentum line crosses above the zero level, it indicates a shift towards bullish momentum. This can signal an upward trend or continuation of an existing uptrend.
- Action: Traders can look for buying opportunities, especially if the momentum line remains above zero and the trend continues to strengthen.
- Bearish Momentum (Below Zero):
- A drop below the zero level signals bearish momentum, suggesting that the market may experience a downward movement.
- Action: Traders should consider selling or looking for short opportunities when the momentum line stays below zero.
- Trend Strength:
- The steepness of the momentum line helps determine the strength of the trend. A steep upward momentum line indicates a strong bullish trend, while a steep downward momentum line suggests a strong bearish trend.
- Action: Traders can adjust their position sizing or trading strategy based on the strength of the momentum.
- Consolidation:
- When the momentum line flattens, it signals a period of consolidation or low volatility in the market. During these times, the market is indecisive, and the trend may not be strong.
- Action: Traders should avoid entering trades during flat sections of the momentum line or wait for a clear breakout signal.
- Divergence:
- Divergence occurs when price action moves in one direction while the momentum line moves in the opposite direction. This often signals a potential trend reversal.
- Action: Traders can use divergence to anticipate potential market reversals and prepare for a change in market direction.
How to Use the Cumulative Momentum Indicator
- Trend Following: Use the momentum line to identify strong trends and ride the wave. When the momentum line is consistently above or below zero, it indicates the prevailing direction of the market. This is ideal for trend-following strategies.
- Reversal Detection: Look for divergence between the price action and momentum line to identify potential reversal points. Divergence often occurs before price action reverses, giving traders a chance to enter positions early.
- Consolidation Breakouts: If the momentum line flattens and then suddenly spikes, this could indicate the beginning of a new trend. Traders can use this as a signal to prepare for a breakout and adjust their trading strategy.
Conclusion
The Cumulative Momentum Indicator is an essential tool for traders seeking to understand market strength and anticipate price movements. By providing a visual representation of momentum, this indicator allows traders to easily spot trends, reversals, and periods of consolidation. Whether you're a beginner or an experienced trader, the Cumulative Momentum Indicator simplifies decision-making, offering clear insights into the market's direction. By combining it with other technical analysis tools, you can further refine your trading strategy and increase the accuracy of your trades.Overall, the Cumulative Momentum Indicator is a versatile and valuable tool for anyone looking to improve their market analysis and make well-informed trading decisions.

