- Joined
- Dec 16, 2024
- Messages
- 302
- Points
- 28
The Chart Overlay Indicator for MetaTrader 4 (MT4) is a customizable tool that enhances the visual clarity of price action and helps traders differentiate market conditions, volume changes, and trend shifts. It overlays custom themes on traditional candlestick charts, making it an ideal tool for traders who prefer a more visually appealing and cleaner chart setup.

Whether you're a scalper, day trader, or long-term trader, the Chart Overlay Indicator can be a valuable addition to your MT4 toolkit, helping you focus on your trading strategy and enhance your overall trading experience.

Key Features of the Chart Overlay Indicator
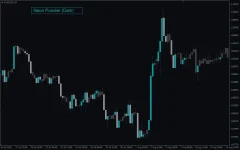
- Customizable Themes: The indicator allows traders to choose from various color schemes, such as "Neon Powder (Dark)" and "Orchid Blue (Light)". These themes help distinguish between bullish and bearish trends, making it easier to interpret price action.
- Volume and Trend Filters: It includes features like volume-based candlestick muting, which helps highlight significant market behaviors. Traders can use this to spot low-volume periods or identify when volume surges, offering valuable context for decision-making.
- Cleaner Charts: By reducing visual clutter and focusing on key price action elements, this indicator provides a cleaner and more intuitive chart experience.
How to Use the Chart Overlay Indicator
While the Chart Overlay Indicator itself does not provide direct buy or sell signals, it enhances the readability of charts, allowing traders to identify potential market behaviors and trends more easily.Key Trading Strategies:
- Identifying Bullish and Bearish Trends: By using different themes (such as Neon Powder (Dark) and Orchid Blue (Light)), traders can visually identify bullish and bearish trends. For example, when the market is trending upwards, the chart may display more prominent bullish candlesticks, while bearish trends are shown with distinct colors for quick visual identification.
- Volume-based Insights: Candlesticks with muted colors may represent periods of low volume, while bright, bold candlesticks could indicate higher volume or more significant market moves. These visual cues can help traders make more informed decisions about market strength or potential reversals.
- Combining with Other Indicators: The Chart Overlay Indicator works best when combined with other technical analysis tools. For instance, using it alongside trend-following indicators or volume indicators can help traders make more accurate decisions about entering or exiting the market.
Example Use Cases
- A bullish trend may be clearly highlighted by using a green neon overlay, which stands out against a muted background of lower volume candlesticks.
- A reversal signal might become more apparent when the candlestick colors shift, indicating a potential change in momentum, which can then be confirmed with other indicators.
Conclusion
The Chart Overlay Indicator for MT4 is a highly useful tool for traders looking to improve the clarity and interpretability of their charts. By providing customizable themes and visual filters, it enables traders to more easily identify market conditions and trends. While it doesn’t generate direct trading signals, the enhanced chart visualization it offers can significantly aid traders in analyzing price action and making more informed decisions.Whether you're a scalper, day trader, or long-term trader, the Chart Overlay Indicator can be a valuable addition to your MT4 toolkit, helping you focus on your trading strategy and enhance your overall trading experience.

