- Joined
- Dec 16, 2024
- Messages
- 302
- Points
- 28
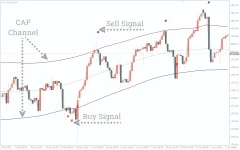
The CAP Channel Trading Indicator is a technical tool designed for channel trading, utilizing an envelope strategy to map the price movement within an upper and lower boundary. These boundaries, or channel lines, are useful for identifying potential overbought and oversold conditions in the market.
- The upper channel line signals an overbought condition.
- The lower channel line signals an oversold condition.
Key Features of the CAP Channel Indicator
- Channel Trading Strategy:
- The indicator uses the concept of envelopes, where price typically stays within the bounds of the upper and lower lines.
- These lines act as dynamic support and resistance levels, guiding traders when to enter or exit trades.
- Volatility Sensitivity:
- The indicator adjusts to price fluctuations, ensuring it provides relevant buy or sell signals in line with market changes.
- Arrows and Crosses:
- The indicator generates arrow signals and crosses to indicate potential trend reversals, giving traders precise entry points for trades.
- Timeframe Versatility:
- Works on any currency pair or instrument, and is effective for long-term and short-term trading strategies.
- The indicator is typically used on timeframes of 15 minutes or higher.

How to Trade with the CAP Channel Indicator
Buy Signal (Bullish Reversal)
- Wait for the price to reach the lower band (the oversold area).
- Buy when the indicator shows a red cross at this level, signaling a potential uptrend.
- Stop Loss: Place the stop loss below the recent swing low.
- Exit: Take profits when the price reaches the upper band, and the indicator posts a blue cross, indicating a market reversal or the end of the uptrend.
Sell Signal (Bearish Reversal)
- Wait for the price to reach the upper band (the overbought area).
- Sell when the indicator posts a blue cross, signaling a potential downtrend.
- Stop Loss: Place the stop loss above the recent swing high.
- Exit: Take profits when the price touches the lower channel line, or when the indicator posts a red cross, signaling the end of the downtrend.
Real Market Example: Gold (XAU/USD)
- Overbought Condition: The price touches the red line (upper channel line), signaling the potential for a downtrend. The indicator confirms this by posting a blue cross, signaling a reversal to the downside.
- Oversold Condition: The price touches the blue line (lower channel line), signaling a potential uptrend. The indicator confirms this by posting a red arrow, indicating a buy signal as the price is expected to reverse to the upside.
Conclusion
The CAP Channel Trading Indicator is a valuable tool for traders who follow the channel trading strategy. By factoring in price volatility and plotting dynamic support and resistance levels, it offers clear signals for buying and selling. Traders only need to wait for price touches at the channel lines and monitor the indicator’s red or blue crosses to time their entries and exits.This indicator is suitable for traders of all experience levels, as it simplifies decision-making by providing easy-to-interpret signals for trend reversals and price movements. It is a must-have tool for those who use channel trading strategies and want to enhance their market timing.

