- Joined
- Dec 16, 2024
- Messages
- 302
- Points
- 28
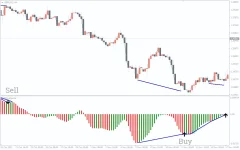
The AO Divergence Indicator, also known as the Awesome Oscillator Divergence Indicator, enhances the functionality of the traditional Awesome Oscillator by integrating divergence detection and additional signals to assist traders in identifying trend direction, strength, and potential reversal points.


Key Features of the AO Divergence Indicator
- Calculation:
- The indicator is based on the difference between two Simple Moving Averages (SMA): a fast SMA and a slow SMA.
- The convergence and divergence of these SMAs determine movement strength and direction while identifying potential reversal points.
- Visual Representation:
- Appears as a colored bar histogram in a separate window below the price chart.
- Green bars: Indicate an uptrend.
- Red bars: Indicate a downtrend.
- Blue divergence lines: Highlight bullish or bearish divergences, signaling potential trend reversals.
- Arrows: Provide BUY/SELL signals based on divergence patterns.
How to Interpret AO Divergence Indicator Signals
1. Divergences and Arrows
- Bullish Divergence + Upward Arrow: Indicates a BUY signal.
- Bearish Divergence + Downward Arrow: Indicates a SELL signal.
2. Histogram Behavior
- Bullish Momentum:
- Histogram rises above the zero line and forms green bars, signifying upward momentum.
- If the bars reverse downward but remain above the zero line, the trend may resume an upswing.
- Bearish Momentum:
- Histogram falls below the zero line and forms red bars, signifying downward momentum.
- If the bars reverse upward but stay below the zero line, the trend may resume a decline.
3. Zero-Line Crossovers
- Buy Signal: Histogram crosses the zero line from below.
- Sell Signal: Histogram crosses the zero line from above.
Example: GBP/USD Chart (H4)
The AO Divergence Indicator identifies key trading opportunities by marking:- Bullish Divergences with upward arrows for BUY signals.
- Bearish Divergences with downward arrows for SELL signals.
- A green histogram above zero and an upward arrow signal a strong BUY opportunity.
- A red histogram below zero and a downward arrow signal a strong SELL opportunity.
Benefits of the AO Divergence Indicator
- Accurate Entry and Exit Points: Combines divergences, histogram analysis, and zero-line crossovers to provide clear trading signals.
- Trend Strength Analysis: Histogram bar length indicates the strength of bullish or bearish momentum.
- Free Availability: The indicator is free to download and can be integrated into trading strategies without additional cost.

